Understanding SEO Reports in Wix Analytics
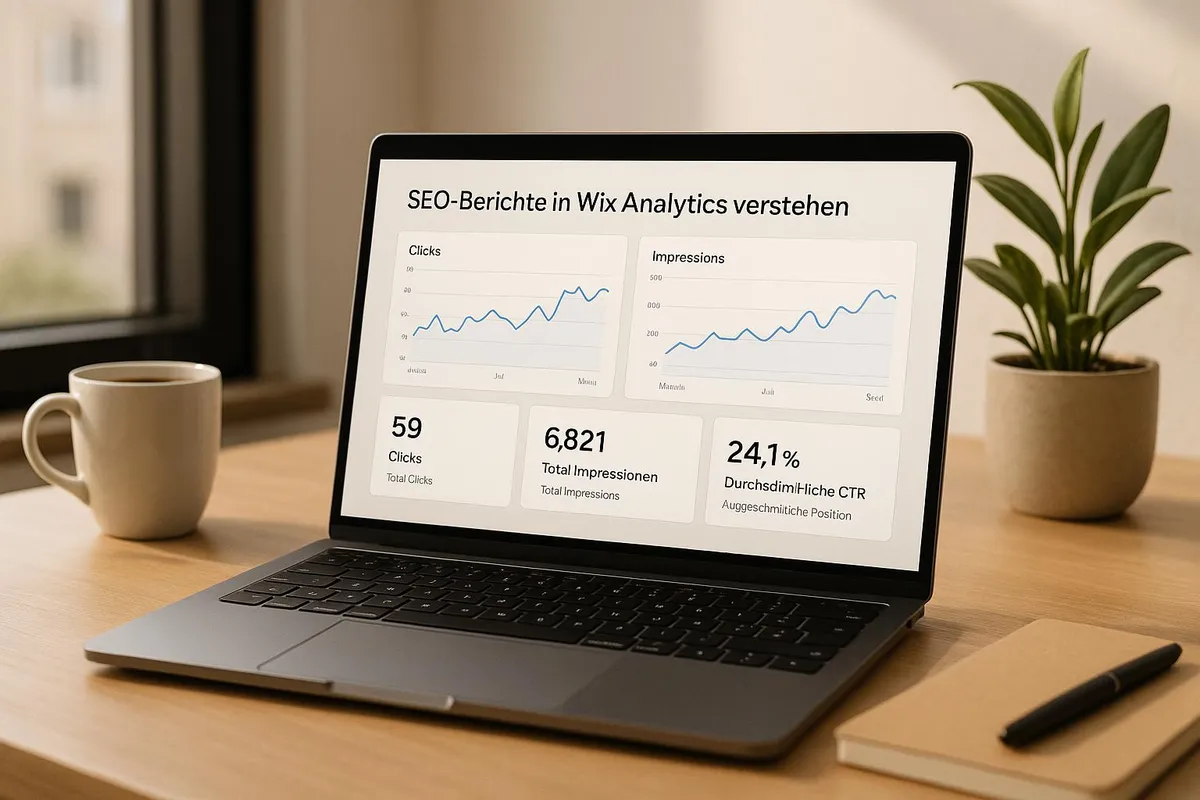
Table of contents 7 sections
- 01Accessing and Navigating Wix Analytics SEO Reports
- 02Key Metrics for Localised Content
- 03Interpreting SEO Data for Localised Content
- 04Steps for Continuous Improvement
- 05Conclusion and Next Steps
- 06Optimising SEO Reports in Wix Analytics for the Austrian Market
- 07Analysing Conversion Rate by Region in Wix Analytics
SEO reports are essential for analysing your website's performance in search engines and making targeted improvements. With Wix Analytics, you get straightforward access to important data such as impressions, clicks, CTR, and average position. Particularly for the Austrian market, where over 90% of search queries go through Google, the tool provides valuable insights.
Key Points at a Glance:
Google data: Delay of up to 72 hours, based on Google Search Console. Report types: Top search queries, page performance, bot traffic, technical status reports. Localisation: Adjust settings for language, region, currency, and time zone. Key metrics for Austria: 92.5% of Austrians research online before making purchases, over 50% use local search queries.
Why SEO Reports Matter:
Measure performance: Which pages and keywords are performing best? Identify weaknesses: Find technical problems and content requiring optimisation. Understand local audiences: Analyse search patterns and regional differences. With this data, you can precisely adjust your SEO strategy, optimise content, and achieve better results in the long term.
Accessing and Navigating Wix Analytics SEO Reports
In Wix Analytics, you will find your SEO reports, which present all relevant data in a clear format. This enables you to more quickly identify where optimisation potential exists.
Accessing SEO Reports in Wix Analytics
To view your SEO reports, navigate to "Analytics" in the website dashboard.
Under "All Reports", you will find a central overview of all analysis data. Scroll down until the "SEO" section appears. Important: Google data is displayed with a delay of up to 72 hours. This information comes directly from Google Search Console and provides you with reliable insights into your website's performance.
The reports are clearly structured and lead you directly to specific analyses, which we will examine more closely in the next section.
Main Areas of SEO Reports
The SEO reports in Wix Analytics are divided into different categories, each illuminating a different aspect of your website performance. This clear structure helps you analyse the data that is important for your strategy in a targeted manner.
Google Search Performance over Time: This report shows how impressions, clicks, and click-through rates develop over different time periods. It gives you an overview of your visibility in Google search results. Top Search Queries on Google: Here you learn which search queries cause your website to appear in Google search results.
Top Pages in Google Search Results: This report shows which pages of your website perform best in search results. Further reports include: Average Position in Google over Time: Track how your search positions develop. Bot Traffic over Time and AI Bot Traffic over Time: Analyse which bots visit your website and how this traffic changes.
Response Status over Time: Identify technical problems on your website. Each report contains a glossary explaining the terms used. Simply click on "Show report definitions" to better understand the terms. To adapt the data for the Austrian market, you also need to configure the localisation settings.
Setting Up Localisation Settings
To ensure your SEO reports accurately reflect the performance of your content for the Austrian market, you should adjust the regional settings in Wix. Navigate to "Language & Region" in the dashboard and set German as the primary language of your website. Make sure to use the European date format (DD.
MM.YYYY), commas as decimal separators, and full stops as thousand separators. Select Euro (EUR) as the currency and set the time zone to Central European Time (CET). If your website is multilingual, you can use Wix Multilingual to configure individual settings for each language version.
This tool supports over 150 languages and enables separate SEO optimisations for each language variant. With these adjustments, your SEO reports are optimally aligned to your Austrian target audience. This gives you the foundation to make informed decisions for your content strategy.
Key Metrics for Localised Content
Analysing the right metrics reveals how effectively your localised content resonates with your target audience. Wix Analytics provides various metrics that are particularly relevant for evaluating localised content.
Core SEO Metrics in Wix Analytics
Impressions and clicks form the basis of your SEO analysis.
Impressions indicate how often your website appears in Google search results, while clicks reflect the actual visits to your page. It is important to consider local search habits when evaluating these figures. The click-through rate (CTR) shows the ratio of clicks to impressions.
A value of 5.2% means, for example, that with 1,000 impressions, 52 users click through to your website. A low CTR can indicate that meta descriptions or titles do not meet the expectations of the local target audience. The average position indicates where your website appears in search results.
A position of 3.5 means your page ranks on average between position 3 and 4. With localised SEO, it is important to note that competition can vary across different markets. Dwell time and bounce rate are further important indicators. They show how well your content resonates with Austrian users.
A dwell time of 2:45 minutes and a bounce rate of 35% can vary depending on industry and target audience. Austrian users often prefer detailed and clearly structured information. Bot traffic provides insights into search engine bot activity on your website. Particularly Googlebot traffic shows how intensively Google crawls your pages.
An increase in bot traffic could indicate that Google considers your localised content relevant. These fundamental metrics are essential for conducting localisation-specific analyses in later steps.
Localisation-Specific Metrics
In addition to the core metrics, localisation-specific metrics provide valuable insights into regional differences.
Regional search queries reveal which terms users use to find your website. Simply translating keywords is not sufficient. Often, direct translations have little to no impact on SEO performance. Language-specific performance differences are particularly relevant when optimising your website for different regions.
Keywords that are successful in one market can be completely irrelevant in another. Therefore, you should analyse the performance of local keywords separately. Geographic traffic distribution shows which regions your visitors come from. This data helps you tailor your content strategy to the needs of your target audience.
Conversion rate by region is another important metric. It shows how well your content not only attracts visitors but also leads to desired actions. Comparing conversion rates across different regions can reveal optimisation opportunities. Seasonal fluctuations also play a significant role.
Users often display specific search habits at certain times, such as increased activity before Christmas or during the summer holidays. You can use these insights to better align your content planning with the needs of your target audience.
Interpreting SEO Data for Localised Content
Correctly interpreting SEO data enables you to make informed decisions and optimise your content in a targeted manner.
With the tools in Wix Analytics, you can analyse, filter, and compare your localised content across different countries. Here you will learn how to get the most out of your reports.
Filtering and Segmenting Reports
Wix Analytics offers numerous options for filtering and segmenting your data to gain deeper insights.
Particularly important for localised content is segmentation by language and geographic location. For example, you can filter reports by visitor type, membership status, browser, or device type. Traffic-by-location reports are a helpful tool for finding out which regions your visitors come from.
This information enables you to focus your marketing strategies on regions with high activity. To better understand the performance of individual language versions, it is advisable to create separate views for each language version. Additionally, you can use time-based filters to identify short-term and long-term trends.
For example, compare Month over Month (MoM) to analyse short-term effects, or Year over Year (YoY) to identify seasonal patterns and long-term developments. Wix Analytics provides you with pre-built reports in categories such as Traffic Overview, Behaviour Overview, and Marketing & SEO Reports. This structured division makes it easy to navigate through your localised data in a targeted manner.
Comparing Performance Across Regions
A regional comparison of your content shows where it resonates particularly well and where there is room for improvement. With Sessions-by-Country reports in Wix Analytics, you can analyse performance across different regions. Compare metrics such as dwell time, page views per session, or bounce rate to identify differences in user behaviour between regions.
Longer dwell times in certain areas can indicate specific content preferences. Conversion rate analysis by region is another valuable tool. With the Revenue by Billing Location report, you can determine which regions generate the most sales.
This information helps you invest your resources strategically in successful regions or optimise weaknesses in a targeted manner. Comparing keyword performance across different language versions can also reveal new optimisation potential. The Top Search Queries on Google report in Wix Analytics helps you identify your best-performing pages.
This way, you can find out which keywords perform particularly well in certain regions. Furthermore, you can compare the behaviour of new and returning visitors in different regions to gain additional insights into usage patterns. With Wix Multilingual, you have the option to customise SEO settings for each language individually.
Set up language dimensions to precisely analyse traffic quality, user behaviour, and conversion rates between the different language versions.
Steps for Continuous Improvement
SEO data is the starting point, but the real key lies in translating these insights directly into action. With Wix Analytics, you have the tools to optimise your localised content in a targeted manner and sustainably improve the performance of your pages.
Identifying Strengths and Weaknesses
The SEO reports in Wix Analytics provide you with a clear overview of your website's performance regarding your business keywords. "Wix Analytics Search Engine Optimization (SEO) reports help you better understand and improve your site's SEO based on your business's information and keywords." – Wix Help Center With reports like Google Search Performance over Time, you can identify successful content.
Top Search Queries and Top Pages show which keywords and pages perform particularly well in different regions. The Average Position report highlights trends, while Bot Traffic and Response Status reports uncover technical problems. These insights help you use historical data to identify long-term optimisation opportunities.
Using Historical Data Strategically
Continuous analysis of historical data is essential, as search engines generate three times more traffic than social media. Regular updates are key: Revise high-performing pages every two months, evergreen content every six months, and update seasonal posts well before the peak season. Pages with declining impressions and clicks often offer the greatest potential for improvement.
One example: WD Strategies was able to generate 55% of total revenue through Google Search within six months after implementing consistent SEO measures. Their organic traffic increased by 12% compared to the previous six months – an impressive annual growth of 43%. Proceed systematically by cleaning up outdated content and focusing on pages that generate the most traffic or leads.
Consider regional search habits and the nature of your content – evergreen posts require less frequent updates than topical content. Once you have identified optimisation opportunities, it is important to share the results with your team to move forward effectively together.
Sharing and Exporting Reports
Use the download menu to export reports as Excel, CSV, or image files, and subscribe to regular updates so your team always stays informed.
Note that table reports can contain a maximum of 5,000 rows. Share custom reports via "More Actions" and add team members. By default, pre-built Analytics reports are visible to all authorised staff. For automated email updates, you can adjust recipients in the Analytics Highlights under "Notifications and Emails".
This structured approach ensures your team works from the same data foundation and collaborates on optimising your content.
Conclusion and Next Steps
In summary: Use the insights gained to define clear goals for your next steps.
The Value of SEO Reports
Regular evaluation of SEO data with Wix Analytics is a central building block for the success of localised content.
According to a survey, 83% of SMEs confirm that data-driven decisions strengthen their local reach. This shows how important it is to make informed decisions based on SEO reports: "Effective SEO reporting can help you make smarter marketing and business decisions." Figures underline the importance of local SEO: 69% of website traffic comes from organic search, with local SEO showing the best performance among all channels at 3.93 page views per session.
Between January 2020 and June 2021, the share of local traffic increased by 52%, while the revenue share grew by 33%. Continuous monitoring of SEO data uncovers new ranking opportunities and helps identify technical problems such as slow loading times early on. With more than 90% of consumers searching for local businesses in 2020, the opportunity to be visible online is enormous.
In the next section, you will learn how Welle West Webdesign can support you in implementing these insights.
Support from Welle West Webdesign
The insights outlined form the basis on which Welle West Webdesign, one of the leading Wix agencies in Austria, strategically develops your web strategy further. Based in Villach and Carinthia, with an impressive 5.0-star rating on the Wix Marketplace, Welle West offers tailored solutions for SEO-optimised websites that deliver measurable results.
The Welle West team supports you in developing your SEO strategy in a structured manner and continuously improving it based on data. Digital marketing expert Ciaran Connolly puts it succinctly: "The businesses that succeed with Wix SEO are those that approach it systematically, measure results, and continuously optimise based on data." Welle West offers a free initial consultation to jointly work out how your website can reach more customers.
With years of experience, the experts develop SEO strategies and professional Wix websites tailored to your individual requirements. The goal: to translate your SEO reports into concrete actions and sustainably strengthen your local online presence.
FAQs
How can I meaningfully account for the delay of up to 72 hours in Google data in Wix Analytics?
The delay of up to 72 hours in Google data in Wix Analytics means that the most recent figures are not immediately available. To ensure you are working with complete and accurate information, you should plan your analyses with a buffer of at least three days. For short-term insights, you can instead rely on real-time or near-real-time data to identify current trends.
Welle West Webdesign advises always keeping this delay in mind when evaluating your results. This enables you to make better decisions about the performance of your content and precisely adjust your long-term strategies.
How do I optimally set up Wix Analytics to customise SEO reports for the Austrian market?
Optimising SEO Reports in Wix Analytics for the Austrian Market
To optimally align your SEO reports in Wix Analytics for the Austrian market, you should make some important adjustments: Set language to German: This makes reports and data easier to understand and tailored to the local target audience. Adjust time zone: Select Central European Time (CET) so that reports accurately reflect the local time. Set currency: Choose Euro (EUR) to display financial data correctly and transparently.
Additionally, you can configure filters to display exclusively data from Austrian users or traffic from Austria. This makes it easier to analyse SEO performance specifically for the Austrian market. Also make use of helpful tools like the Wix SEO Wiz and the SEO Dashboard to optimise your content specifically for the Austrian target audience.
These tools help you make your website more visible and relevant for Austrian users.
How can I evaluate the conversion rate by region in Wix Analytics to optimise my website in a targeted manner?
Analysing Conversion Rate by Region in Wix Analytics
With Wix Analytics, you can segment your data by region to see how the conversion rate develops in different geographic areas.
These regional insights are extremely helpful for adjusting your strategy in a targeted manner – whether through tailored marketing campaigns or content designed to meet the needs of specific regions. Look not only at visitor numbers but also at behavioural patterns and conversion data. This provides you with a solid foundation for making informed decisions about optimising your website.